
Nike's revenue stopped falling. Is a recovery in sight?
The freefall in Nike's revenue has stopped, but cash generation kept sliding and the dividend is no longer covered. Does Wall Street see more pain ahead, or a turn? The consensus is clearer than you'd think.
In April we compared four fallen stocks: Duolingo, Hims & Hers, Nike and PayPal, each down 70 to 85% from its high. Nike was the one where we concluded the decline was earned. Revenue was falling, every margin was compressing, and at 29 times earnings the model put the stock close to fair value rather than cheap.
Four months on, Nike is the only one of the four that has fallen further, down 8.3% while the other three rose between 30% and 57%. That is not the interesting part. The interesting part is that Nike closed its 2026 fiscal year on 31 May, and those accounts have since landed in our database. They describe a company whose revenue has stopped falling and whose cash generation has not.
The top line has stabilised
Start with what improved, because something genuinely did.
Table 1. Nike fiscal year results, as we hold them. FY2026 ended 31 May 2026.
| FY2024 | FY2025 | FY2026 | |
|---|---|---|---|
| Revenue | $51.36B | $46.31B | $46.40B |
| Revenue growth | +0.3% | -9.8% | +0.2% |
| Gross margin | 44.6% | 42.7% | 42.9% |
| Operating margin | 12.3% | 8.0% | 8.2% |
| Net income | $5.70B | $3.22B | $3.11B |
| Earnings per share | $3.76 | $2.17 | $2.10 |
| Debt to equity | 0.83 | 0.83 | 0.74 |
After a year in which revenue fell almost 10%, it went sideways. Gross margin stopped compressing and recovered 20 basis points. Operating margin did the same. Leverage came down.
Those four lines are the ones that turned. Revenue, gross margin, operating margin and debt to equity all moved the right way in FY2026, having all moved the wrong way in FY2025. Net income and earnings per share are still falling, so the recovery has not reached the bottom of the table yet, but it has reached the top of it. That is the first evidence in the reported accounts that Elliott Hill's turnaround is doing something.
That is a real change from what we wrote in April, and it deserves saying plainly. The freefall in the revenue line has stopped.
The cash flow tells a different story
Now the rest of the same accounts.
Table 2. Nike cash generation and capital returns.
| FY2024 | FY2025 | FY2026 | |
|---|---|---|---|
| Free cash flow | $6.62B | $3.27B | $2.18B |
| Return on invested capital | 18.5% | 11.6% | 10.7% |
| Return on equity | 39.5% | 24.4% | 20.9% |
| Dividends paid | $2.17B | $2.30B | $2.41B |
| Share buybacks | $4.25B | $2.99B | $0.15B |
| Dividend payout ratio | 38.1% | 71.5% | 77.5% |
Free cash flow fell another 33%, on top of the 51% fall the year before. It is now barely a third of what it was two years ago. Returns on capital kept sliding. And the two capital-return rows are the ones we would point at first.
Nike bought back $4.25 billion of its own stock in FY2024 and $5.48 billion the year before that. In FY2026 it bought back $146 million. That is not a reduction, it is a stop.
Meanwhile the dividend went up again, from $1.55 to $1.62 a share. Put the two together and you get the fact that we think matters most in this set of accounts: Nike paid out roughly $2.41 billion in dividends against $2.18 billion of free cash flow. The dividend was not covered by the cash the business generated.
That has happened only once before in the decade we hold, in FY2020, when Nike's stores were shut for a global pandemic and free cash flow briefly collapsed to $1.4 billion. It recovered to $5.96 billion the following year. What is different this time is that there is no single event to point at, and no snap-back in the year that followed. FY2026 is the second consecutive year of sharply lower cash generation, not a one-off.
That is what the buyback collapse is telling you. Faced with a third of the free cash flow it had two years ago, and a dividend it has raised every year for more than two decades, Nike protected the dividend and switched off everything discretionary.
Which matters, because Nike is now being sold as a dividend stock
At $40.51 the shares yield 4.02%. That is a high yield for Nike by any historical standard, and it is starting to attract the label. In the fortnight before we wrote this, the financial press asked whether Nike is now the ultimate dividend stock to buy, and listed it among relatively secure and cheap dividend payers.
A 4% yield on a brand like Nike is a genuinely interesting proposition. But a yield is a fraction, and this one rose mostly because the denominator fell. What decides whether it is durable is the payout, and the payout is now around 78% of earnings and slightly more than 100% of free cash flow.
None of that means the dividend is about to be cut. Nike has a manageable balance sheet, leverage came down this year, and a company of this size has plenty of levers before it touches the dividend. It does mean that the dividend is no longer being funded out of surplus. On FY2026's numbers it is being funded out of the same cash flow that would otherwise pay for buybacks, and the buybacks have already gone.
What the Street expects next
Our model does not guess at Nike's revenue. It takes analyst consensus, so it is worth seeing that consensus in full, including how many analysts stand behind each year.
Table 3. Analyst consensus for Nike, as we hold them. FY2026 is actual.
| Fiscal year | Revenue | Growth | Analysts | EPS | EPS range |
|---|---|---|---|---|---|
| FY2026 (actual) | $46.40B | +0.2% | - | $2.10 | - |
| FY2027 | $45.71B | -1.5% | 29 | $1.73 | $1.49 to $2.29 |
| FY2028 | $47.38B | +3.7% | 27 | $2.18 | $1.58 to $3.72 |
| FY2029 | $48.65B | +2.7% | 16 | $2.38 | $1.45 to $3.72 |
| FY2030 | $58.26B | +19.8% | 8 | $4.25 | $4.04 to $4.59 |
The shape of that path is a trough followed by a recovery.
FY2027 is the trough. Revenue slips 1.5%, to just below the FY2026 level, and earnings fall to $1.73, about 18% below what Nike has just reported. So the consensus does not treat this year's stabilisation as the turn; it expects one more soft year first.
From FY2028 the direction changes and stays changed. Revenue rises in each of the three following years, from $47.38B to $58.26B. Earnings rise faster: $2.18, then $2.38, then $4.25 by FY2030. On this path Nike is earning more than it does today by FY2028, and by FY2030 it is earning more than the $3.83 it made at its FY2022 earnings peak. Taken as a whole, the Street is forecasting a full recovery, with the pace picking up in the later years.
The ranges around those averages are wide, and widen with distance. FY2028 spans $1.58 to $3.72, and FY2029 spans $1.45 to $3.72. Some of that is ordinary forecast uncertainty at three and four years out, and the number of analysts contributing falls from 29 in FY2027 to 8 by FY2030, which is also normal that far ahead. It is worth knowing that the later, stronger years are the ones estimated by the fewest people and carry the widest ranges.
Underneath the revenue line sits a margin assumption. Nike's operating margin is 8.2%. The forward estimates we hold imply roughly 11.7%, and Nike last cleared that in FY2024 at 12.3%. So the consensus earnings path requires about 350 basis points of margin recovery. That is the number to watch in the quarterly reports, because it is what the recovery in the table is made of.
What Nike is worth on our model
Table 4. Nike DCF inputs and output, 13 August 2026 model run.
| FY2026 revenue | $46.40B |
| Revenue growth (analyst consensus, CAGR to furthest estimate) | 5.86% |
| EBITDA margin (normalized) | 9.6% |
| Free cash flow (FY2026) | $2.18B |
| Discount rate (market-derived WACC) | 8.32% |
| Terminal growth | 3.63% |
| Fair value | $43.20 |
| Price | $40.51 |
| Upside | +6.6% |
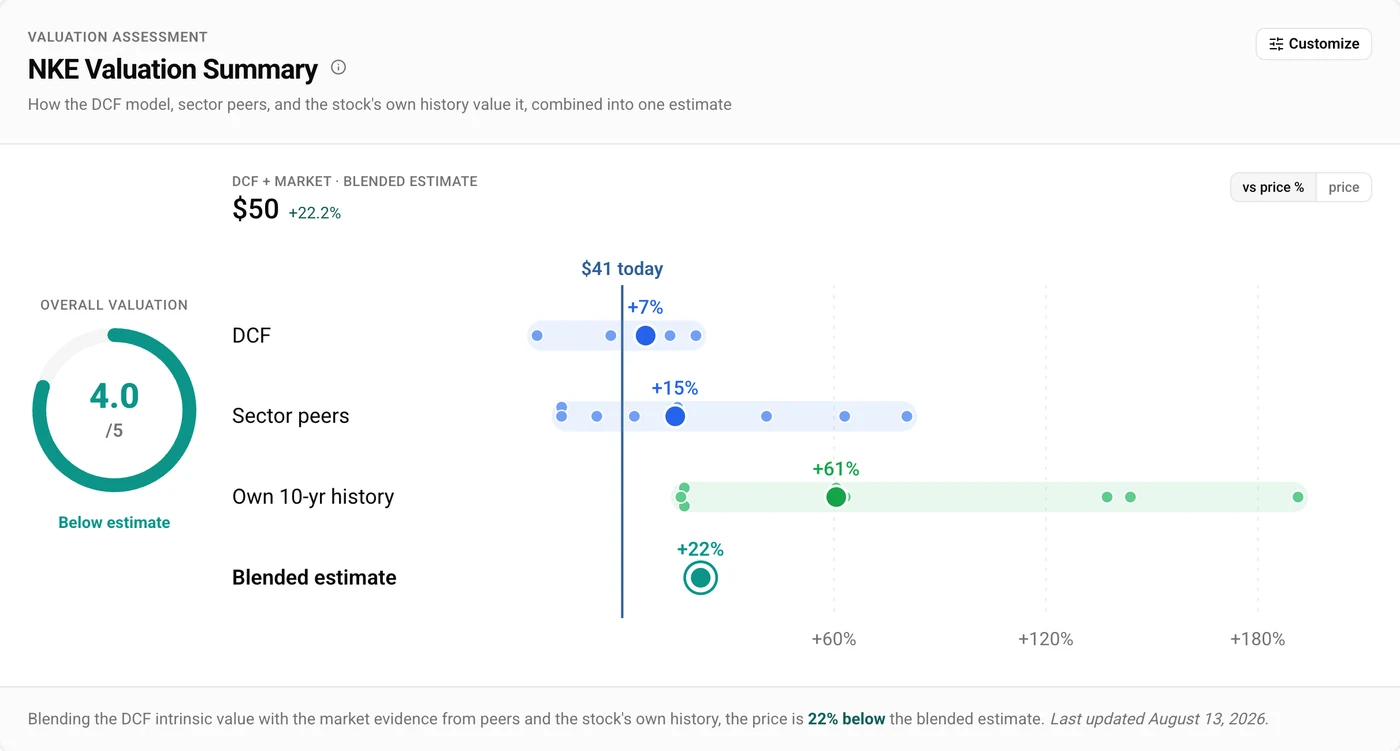
So the model values Nike a little above its current price. Our blended estimate, which also weighs sector peers and Nike's own 10-year trading history, is more generous at $49.51, or 22.2% above the price.
Both figures take the analyst path in Table 3 as given, including the FY2030 estimate, which the model carries verbatim and then compounds from for the remaining years. That final year does a lot of the work: run the same model on FY2027 to FY2029 only and the fair value is $27.44 rather than $43.20. Which of those two numbers is the right one depends entirely on whether Nike's recovery extends into FY2030 the way the Street currently projects.
The part of the business that is still shrinking
One more reason to be careful with the word stabilised. Nike's revenue was flat in aggregate, but Greater China, historically its most profitable growth engine, was not.
Table 5. Nike Greater China revenue.
| Fiscal year | Greater China revenue | Share of segment revenue |
|---|---|---|
| FY2024 | $7.55B | 15.3% |
| FY2025 | $6.59B | 14.7% |
| FY2026 | $5.85B | 12.9% |
China fell another 11.2% this year and is down 22.5% from its FY2024 level. A flat total with a shrinking China means the rest of the business grew slightly to offset it. That is better than the alternative, but it is not the same thing as the business turning, and it means the mix is moving away from where Nike's margins were historically best. Tariffs are a live cost pressure on top of that.
Where that leaves Nike
At $40.51 Nike is about 77% below its high, yields 4.0%, and trades at a little over 19 times earnings. On our model it is worth somewhat more than it costs, and on our blended estimate, more again.
The reported accounts and the forecasts point in different directions right now, and it is worth holding both.
In the accounts, FY2026 is the year the top of the income statement stopped deteriorating: revenue flat, both margins up, leverage down. It is also the year cash generation got materially worse, with free cash flow down a third, buybacks switched off and the dividend no longer covered by the cash the business produces. The turnaround has reached the revenue line and has not yet reached the cash flow.
In the forecasts, the Street expects one more soft year and then a genuine recovery, with earnings climbing past today's level in FY2028 and past its FY2022 earnings peak by FY2030. That path needs about 350 basis points of operating margin that Nike has not yet recovered, and its later and stronger years are estimated by the fewest analysts. Our own fair value depends on it: on the full path Nike screens as modestly cheap, and on the near years alone it does not.
So the question a buyer is really answering is not whether Nike is a good brand, or even whether it is cheap on today's earnings. It is whether the margin recovery the consensus has penciled in for FY2028 onwards actually arrives, and whether free cash flow rebuilds fast enough to cover the dividend and restart the buyback along the way. The quarterly gross and operating margins are where that shows up first.
Those are the numbers to argue about, and you can change the assumptions yourself on Nike's valuation page and see its full 5D analysis.
A DCF is one lens, not a verdict. Nike is a candidate for your own research, not a recommendation.
All financial data sourced from Stockoscope's database, powered by Financial Modeling Prep API. Price and model run as of 13 August 2026. The FY2027-to-FY2029 valuation quoted above was produced by re-running our production valuation engine with the FY2030 estimate excluded and every other input unchanged; the control run reproduced our published fair value exactly.