
August 2026: 800 Members, and a New Way to See the Market
Stockoscope just passed 800 members. July was our first full month live: the Screener gained the Map, a new way to plot any two metrics against each other, and the Valuation page now shows every method of valuing a stock on one chart.
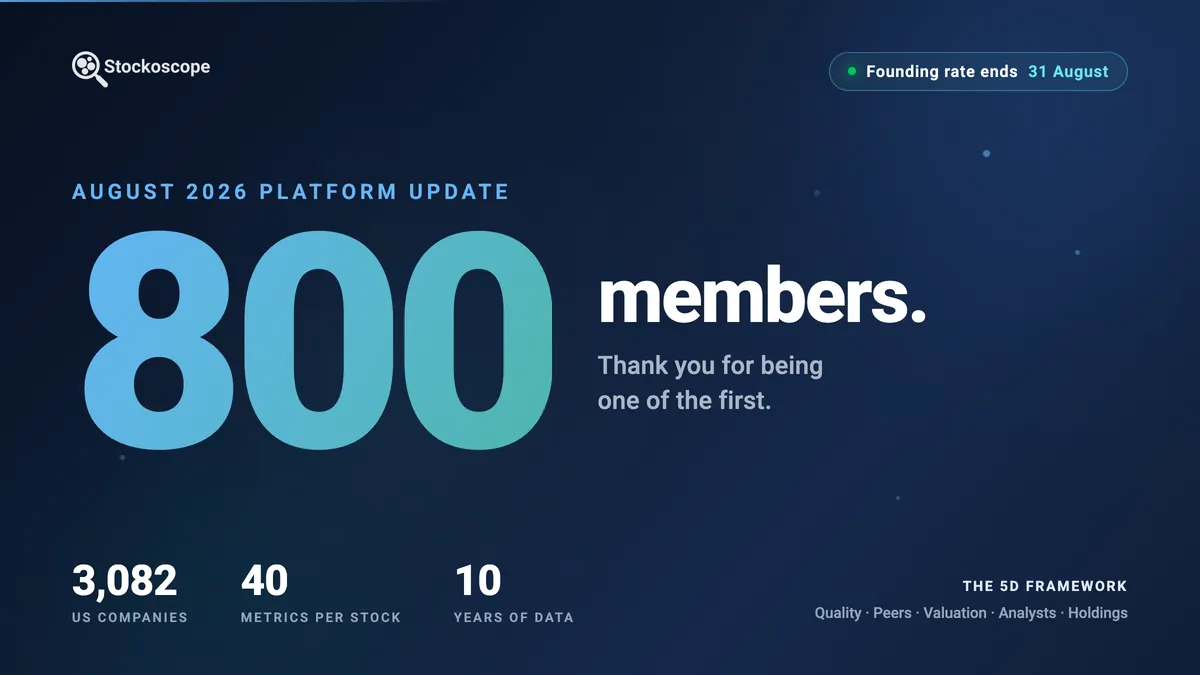
We just passed 800 members. Thank you.
A little over a year ago Stockoscope was a beta with a handful of testers. It is now a live platform with 800 people using it to research stocks. That matters more to a small team than we can easily say. Thank you.
July was our first full month live. Here are the updates.
Founding Pricing Ends 31 August
If you have been meaning to subscribe, this is the month to do it. Subscribe annually before 31 August and you pay $99/yr, locked in for three years. After that, annual pricing is $150.
Until 31 August, every signup starts with a 28-day free trial, and no card is needed to begin.
Screener Map
The Screener has a new way to look at the market. Pick any two metrics and every company is plotted on a chart split into four quadrants: high returns and a low valuation in one corner, the reverse in another.
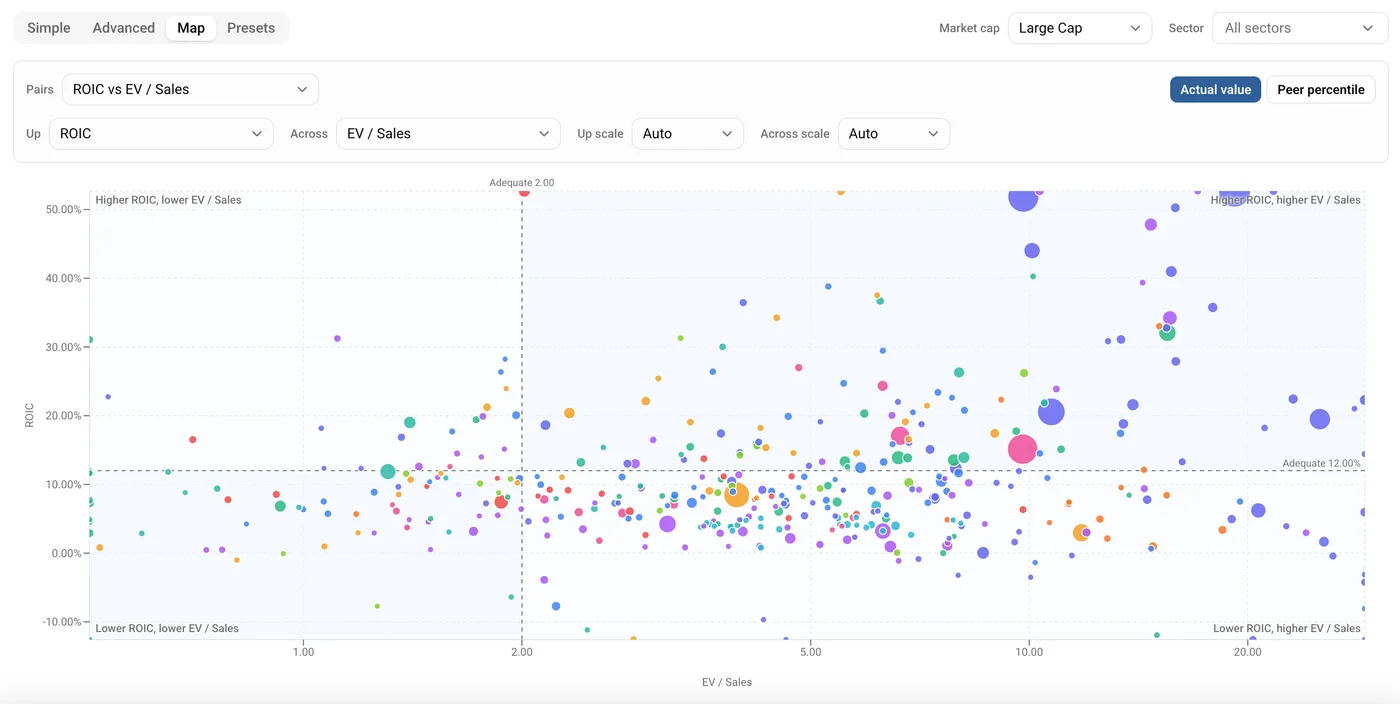
It is far quicker than reading down a table. Start from one of nine ready-made pairs if you want a shortcut, or set both axes yourself, and you can send someone the exact view just by copying the link. Included with Pro.
Here's a blog post for further details: The Map: See Quality and Price at the Same Time
Valuation Football Field
A stock can be valued several different ways, and those ways rarely agree. Our Valuation page used to show them in separate boxes that were hard to compare.
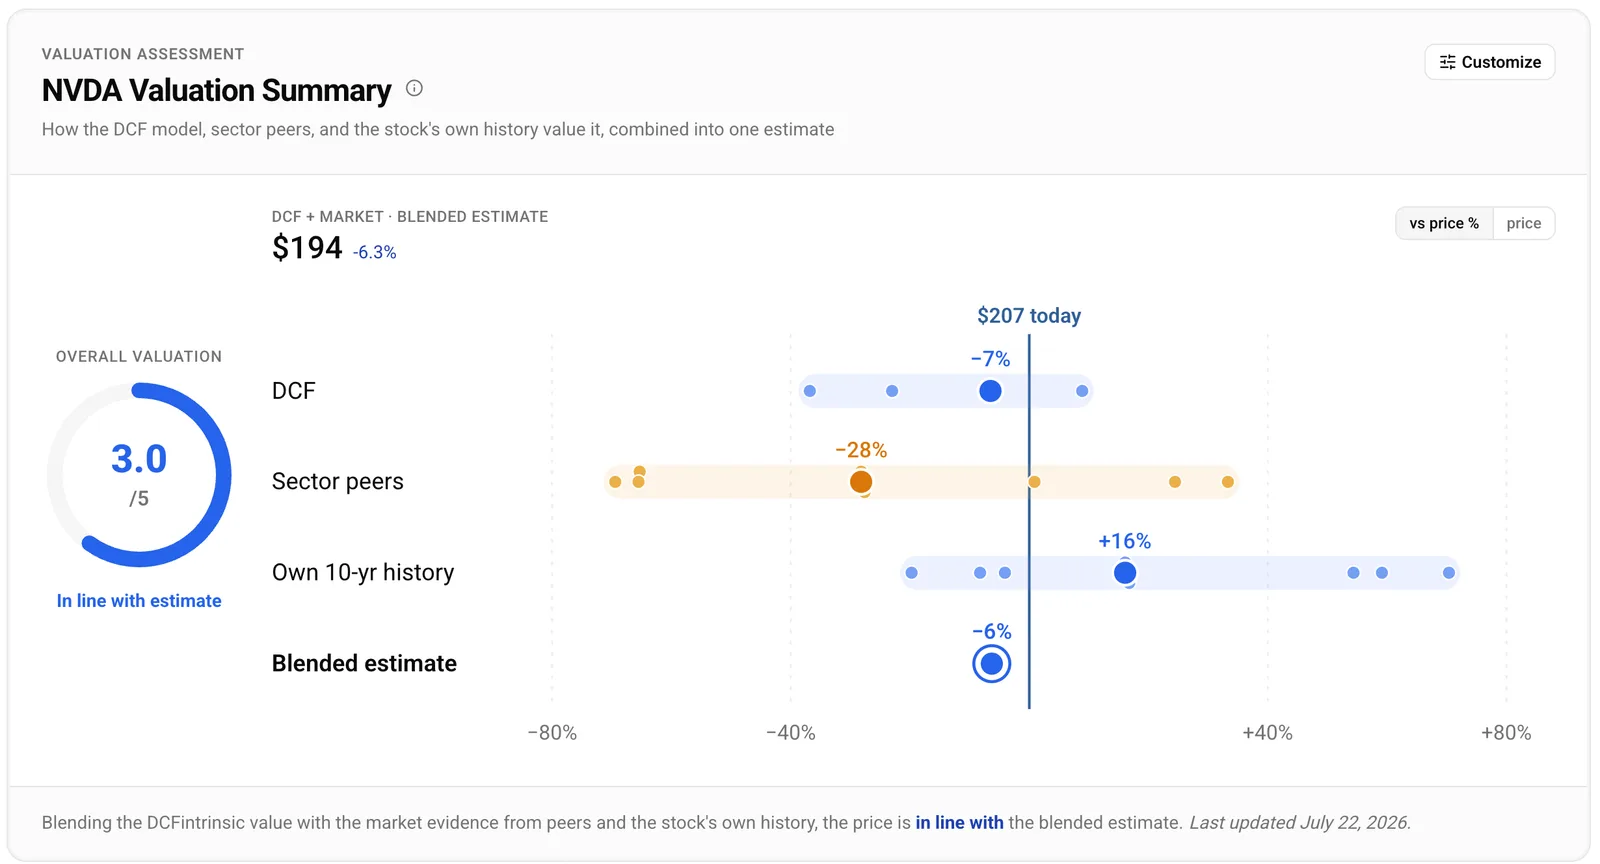
Now they sit on one chart, on one scale: what our cash flow model says, what the stock's sector peers imply, what its own trading history implies, and the combined estimate. You can see at a glance where the methods agree and where they pull apart.
We wrote up the thinking behind it in The Valuation Football Field.
Embed Our Charts in Your Own Writing
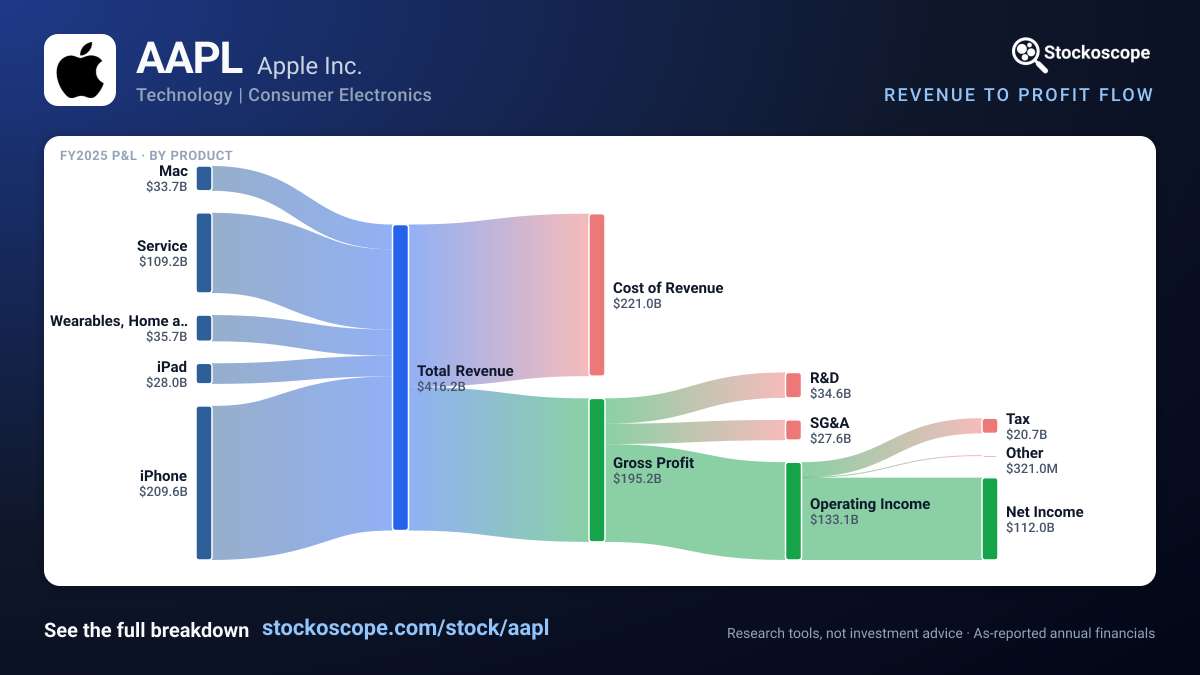
If you write a blog, a newsletter or a forum post, every stock page now has an Embed button. Copy the snippet, paste it in, and you get a live chart that keeps itself up to date: the 5D scorecard, the revenue breakdown, or the Wall Street analyst consensus.
Here is one running live in this article, pasted straight from the Embed button on Apple's Overview page. Nothing is stored here: the chart is drawn on our side each time, so it stays current on its own.
Also This Month
- The Analysts page now shows a single clear rating trend, replacing two separate numbers that did not always line up.
- Company pages open in one step, so they load noticeably faster.
- Not signed in? The Screener, Strategies and Watchlists now show a working preview instead of a login wall.
- The All Companies directory has been rebuilt as a browsable index of all 3,082 companies.
From the Blog
Most of July went to one question: what the AI spending boom does to a company's valuation.
Meta's Capex Bet: One Number Decides Whether It's Cheap or Expensive One assumption decides it: our model says about $659 if capex normalizes, about $331 if it stays elevated.
Alphabet's Capex Doubled, Its Free Cash Flow Didn't: A Fresh Look at Google's Valuation Capex doubled while free cash flow did not follow. What that does to the valuation.
The AI-Capex Bet in Reverse: What Microsoft, Meta and Alphabet's Prices Already Assume We ran the model backwards, holding each price fixed, to work out what returns the market is already counting on.
The Capex Switch: How We Model AI Capital Spending in a DCF Why the assumption you make about future capital spending can move a valuation more than almost anything else, and how we handle it.
Oracle Update: The OpenAI Risk Faded, the Debt Risk Became a Downgrade Four months on from our case study, the stock is back where it started but a lot has changed underneath.
Nvidia Is Not Priced for Perfection. It's Priced for a Slowdown. Consensus already has growth falling from 82% to 13% in four years. Run that slowdown through the model and the stock still comes out near where it trades.
The Valuation Football Field: Different Ways to Value a Stock on One Chart How to read a dozen different valuation estimates side by side without losing the plot.
All at stockoscope.com/blog.
Stay Connected
Follow the platform on X (@stockoscope and @StockoscopeTeam), and our founder (@nav_dhand), for daily research and updates. Join the conversation at r/stockoscope.
We Want to Hear From You
- Have you tried the Map? Which two metrics did you plot first?
- Is the new Valuation chart easier to follow than the old layout?
- What should we build next?
Send feedback through the platform or reply to our newsletter. We read every one, and it shapes what we work on.
Thank you again for being one of the first 800.
Best regards,
Stockoscope Team