
Three of These Five Homebuilders Are Priced the Same. One Is a Much Better Business.
The five large US homebuilders are down between 19% and 58% from their 2024 peaks while the market rose 36%. We ran all five through quality, peers and valuation. Valuation barely separates the top three, which leaves the business to decide it.
Twenty homebuilders trade on the US market and five of them are large caps. Those five peaked within ten weeks of each other in autumn 2024, and all five have fallen since. Over the same stretch the Russell 3000 rose 36%.
Table 1. Peak-to-date falls, against the Russell 3000
| Peak close | Peak date | 23 Sep 2026 | From peak | Past year | |
|---|---|---|---|---|---|
| Lennar (LEN) | 192.45 | 19 Sep 2024 | 81.52 | -57.6% | -33.9% |
| NVR (NVR) | 9,924.40 | 18 Oct 2024 | 6,246.31 | -37.1% | -21.7% |
| D.R. Horton (DHI) | 197.06 | 19 Sep 2024 | 140.17 | -28.9% | -15.7% |
| PulteGroup (PHM) | 149.04 | 18 Oct 2024 | 118.71 | -20.4% | -8.7% |
| Toll Brothers (TOL) | 167.80 | 25 Nov 2024 | 135.29 | -19.4% | -1.0% |
| Russell 3000 | +36.1% |
One footnote on Lennar first. It spun off Millrose Properties in February 2025, one Millrose share for every two Lennar shares, and Millrose is worth 26.81 today. A holder from the peak owns 81.52 of Lennar plus 13.41 of Millrose, so the real fall is about 51%, not 58%. Still the worst of the five, but the raw chart overstates it by seven points.
The cause is not in dispute. The 30-year fixed mortgage was 6.95% on 17 September against 6.35% a year earlier, the 10-year Treasury pushed through 5%, and existing-home supply reached 4.9 months, the highest in over a decade. Builders respond by holding the sticker price and buying the mortgage rate down, so the hit lands in gross margin rather than in the selling price. Revenue is down single digits across the group while operating profit is down between 16% and 51%.
What is in dispute is what to do about it. A 19% fall and a 51% fall in one industry on one interest rate is a spread worth explaining, so we asked the two questions the framework is built for. Are these still good businesses? And is any of them actually cheap? Only one of those questions separates them.
Are these still good businesses?
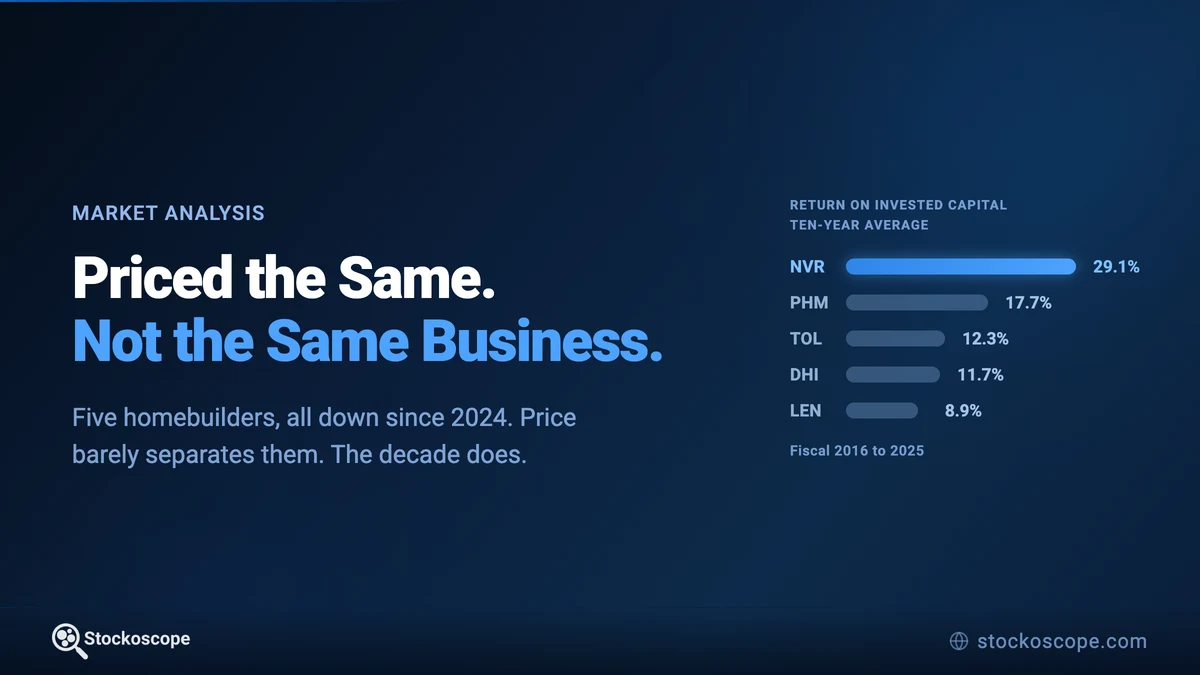
Quality is the ten-year view, so a bad eighteen months cannot dominate it. Here is each company averaged across fiscal 2016 to 2025, with the trend direction our model reads from the ten-year series.
Table 2. Ten-year quality averages, fiscal 2016 to 2025
| Quality | ROIC | Op margin | Net margin | FCF margin | Inv. days | |
|---|---|---|---|---|---|---|
| NVR | 3.60 | 29.1% stable | 18.2% stable | 15.1% stable | 13.2% | 90 |
| PulteGroup | 3.50 | 17.7% declining | 20.0% stable | 15.3% stable | 9.0% | 382 |
| Toll Brothers | 3.19 | 12.3% improving | 16.9% improving | 13.1% improving | 9.7% | 479 |
| D.R. Horton | 3.09 | 11.7% declining | 15.3% declining | 12.0% declining | 5.6% | 337 |
| Lennar | 2.80 | 8.9% declining | 10.5% declining | 7.4% declining | 8.3% | 177 |
Of the five, exactly one held its returns across the decade and exactly one improved. The other three are declining on return on capital, and two of them, D.R. Horton and Lennar, on margins as well.
The endpoints say it more plainly than the averages do. Return on invested capital, first fiscal year to last:
Table 3. Return on invested capital, first fiscal year of the decade to last
| FY2016 | FY2019 | FY2022 | FY2024 | FY2025 | Change | |
|---|---|---|---|---|---|---|
| NVR | 21.0% | 26.9% | 36.8% | 30.2% | 25.9% | +4.9pp |
| Toll Brothers | 3.9% | 5.5% | 11.7% | 14.2% | 11.3% | +7.4pp |
| PulteGroup | 7.8% | 11.8% | 21.6% | 19.8% | 14.3% | +6.5pp |
| D.R. Horton | 8.3% | 10.6% | 21.2% | 13.7% | 10.1% | +1.8pp |
| Lennar | 5.9% | 6.8% | 15.3% | 10.3% | 6.6% | +0.7pp |
NVR is the structural outlier. It does not own its land. It options lots from developers and walks away if the deal stops working, which is why it carries 90 days of inventory where Toll carries 479 and Pulte 382. That model never earned below 17% on invested capital in any year of the decade and reached 37% at the peak, through a boom and now through a downturn. The consistency matters more than the level.
Toll Brothers is the improvement story. It started the decade earning 3.9% on capital on a 9.5% operating margin, close to the cost of doing business, and ends at 11.3% and 15.7% after moving deliberately up market. Its quality score is still middling because the model averages ten years and most of them were poor, but it is the only one of the five whose returns, operating margin and net margin all point up.
Lennar is the other end. It went through the largest housing boom in forty years and came out with a return on capital 0.7 points higher than where it started and an operating margin 3.4 points lower. Fiscal 2025 was the worst year any of the five has printed since 2019, and it ended in November, before the worst quarters were reported.
One thing is uniform. All five are decelerating on revenue, EBIT, earnings per share and book value growth. That is the cycle, and nobody has escaped it.
Where they stand right now
Quality is the decade. Peers is the last twelve months, which is where the current damage shows up.
Table 4. Trailing twelve months
| Peers | Revenue | Growth | Op margin | ROE | ROIC | FCF yield | Net debt / EBITDA | Inv. days | |
|---|---|---|---|---|---|---|---|---|---|
| NVR | 3.93 | $9.4bn | -10.6% | 14.9% | 31.0% | 24.3% | 6.2% | -0.10 | 111 |
| PulteGroup | 3.84 | $16.4bn | -7.3% | 14.6% | 14.7% | 11.6% | 6.6% | 0.40 | 404 |
| Toll Brothers | 3.82 | $10.8bn | -1.1% | 13.8% | 14.2% | 9.8% | 8.6% | 1.11 | 522 |
| D.R. Horton | 3.77 | $33.4bn | -3.5% | 11.6% | 12.8% | 8.5% | 8.4% | 1.24 | 377 |
| Lennar | 1.84 | $32.0bn | -8.0% | 5.3% | 6.0% | 4.0% | 5.0% | 1.60 | 163 |
Four of the five sit within 0.16 of each other. Lennar sits two points below all of them, on a 5.3% operating margin against 11.6% to 14.9% for everyone else, and its trailing operating profit is down 50.8% against Toll's 15.8%.
Trailing figures lag, though, because they carry three good quarters alongside one bad one. The quarterly sequence shows where each business actually is.
Table 5. Operating margin by quarter, last four reported
| -3 | -2 | -1 | Latest | Latest quarter ended | Revenue year on year | |
|---|---|---|---|---|---|---|
| D.R. Horton | 11.6% | 10.6% | 10.6% | 13.3% | Jun 2026 | 0.0% |
| PulteGroup | 17.3% | 16.3% | 12.9% | 11.1% | Jun 2026 | -9.6% |
| NVR | 16.9% | 16.5% | 12.0% | 13.3% | Jun 2026 | -10.6% |
| Toll Brothers | 16.5% | 10.2% | 13.7% | 13.5% | Jul 2026 | -9.7% |
| Lennar | 7.1% | 3.5% | 4.4% | 5.7% | Aug 2026 | -8.7% |
D.R. Horton is the only one whose latest quarter is flat on revenue, and it recovered nearly three points of margin after two quarters at 10.6%. Lennar has two quarters of sequential recovery too, though from a 3.5% floor nobody else has been near. PulteGroup is the only one that has not stopped falling, and it has the highest margin in the group to fall from.
The reported detail behind those numbers is worth a paragraph. In their most recent quarters PulteGroup posted a 25.0% home sales gross margin with orders up 6% on incentives of 10.4%, Toll 23.9% with contracts up 5% and community count up from 420 to 471, D.R. Horton 20.7% with orders flat and cancellations at 20% against 17%, NVR 19.2% with orders up 9%, and Lennar 15.8% with orders down 9% on incentives running at 12% of a $372,000 average price, alongside another cut to its delivery target. Lennar is spending the most to move homes and selling the fewest. That is the gap between a 19% fall and a 51% one.
All five are shrinking their share count, which flatters every per-share figure above: Lennar down 7.0% year on year, NVR 7.9%, Toll 4.9%, Pulte 3.4%, D.R. Horton 3.0%.
Is any of them actually cheap?
Measured against the wider consumer cyclical sector, every one of these looks like a bargain. Toll's price to earnings ratio of 10.8 sits in the 97th percentile of that sector for cheapness, against a sector median of 19.8. Run the comparison that way and the model reports upside of 43% to 73% for three of the five.
That comparison tells you very little. Homebuilders have always traded at a discount to the rest of consumer discretionary, because their earnings are cyclical and the market refuses to capitalise a peak. Finding that a builder is cheaper than the median consumer stock tells you it is a builder.
The comparison that means something is each company against its own ten-year multiple history. A positive number below means the stock trades above its own norm, which is to say more expensive than usual.
Table 6. Earnings multiples against each company's own ten-year median
| P/E now | Own 10yr | vs | EV/EBIT now | Own 10yr | vs | |
|---|---|---|---|---|---|---|
| NVR | 15.37 | 15.45 | -1% | 11.19 | 11.26 | -1% |
| Toll Brothers | 10.79 | 9.72 | +11% | 9.13 | 8.64 | +6% |
| D.R. Horton | 13.31 | 11.90 | +12% | 11.10 | 9.72 | +14% |
| PulteGroup | 12.08 | 8.53 | +42% | 10.31 | 7.11 | +45% |
| Lennar | 15.41 | 9.99 | +54% | 12.31 | 9.96 | +24% |
Table 7. Asset multiples against each company's own ten-year median
| P/B now | Own 10yr | vs | EV/Sales now | Own 10yr | vs | |
|---|---|---|---|---|---|---|
| NVR | 5.04 | 5.49 | -8% | 1.77 | 1.91 | -7% |
| Toll Brothers | 1.51 | 1.14 | +32% | 1.35 | 1.17 | +15% |
| D.R. Horton | 1.69 | 1.94 | -13% | 1.33 | 1.18 | +12% |
| PulteGroup | 1.75 | 1.83 | -4% | 1.46 | 1.20 | +21% |
| Lennar | 0.90 | 1.36 | -34% | 0.73 | 1.23 | -41% |
Not one of the five is cheap against its own decade on earnings. NVR is the only one below its own history on every multiple, and only just, within a point of it on both earnings measures. Toll is closest among the rest at 6% above on EV/EBIT. PulteGroup and Lennar are the most expensive, because their earnings have fallen further than their share prices.
Lennar is the one exception, and only on assets: 0.90 times book against a 1.36 decade median, 0.73 times sales against 1.23. That is what "below book value" means when people say it about Lennar. It is an argument about what the land is worth, not about what the business earns.
One trap worth naming. D.R. Horton trades at 11.8 times free cash flow against a 30.2 decade median, a 61% discount that looks extraordinary. Builder free cash flow rises in a downturn because they stop buying land, which converts working capital into cash. That is a position in the cycle, not a valuation signal, and it reverses the moment they start buying lots again.
The discounted cash flow model reaches the same place from a different direction, with one exception that needs explaining.
Table 8. Discounted cash flow, as published
| Price | Intrinsic value | Upside | Revenue growth used | Source | Usable estimate years | |
|---|---|---|---|---|---|---|
| PulteGroup | 118.71 | 112.75 | -5.0% | 1.96% | analyst | 3 |
| Toll Brothers | 135.29 | 121.14 | -10.5% | 2.87% | analyst | 3 |
| D.R. Horton | 140.17 | 119.78 | -14.5% | 2.48% | analyst | 3 |
| Lennar | 81.52 | 65.50 | -19.7% | -0.34% | analyst | 3 |
| NVR | 6,246.31 | 11,792.35 | +88.8% | 6.47% | historical | 2 |
NVR is the exception, and it is worth explaining rather than quoting. Our model builds its revenue forecast from analyst estimates and needs at least three forward years, each covered by at least three analysts. NVR has two: its 2028 revenue line carries a single analyst, so that year is discarded, and with only two left the model abandons consensus and substitutes NVR's own ten-year historical growth rate of 6.47%.
That substitution does two things rather than one. It sets the forecast growing at 6.5% a year when NVR's own analysts have revenue falling from $10.32bn in 2025 to $10.00bn in 2027. And because the model holds terminal growth a point below the forecast rate, the high forecast also lets NVR's terminal growth float to 3.81% where the other four are pulled down to between 1.0% and 1.9%. That hands NVR a perpetuity multiple of 21.6 times against 11.5 to 13.7 for its peers, applied to two thirds of enterprise value.
So we re-ran it on the analyst path. Using 2026 and 2027 consensus, both covered by three analysts, intrinsic value comes out at $5,766, or 7.7% below the price; include the thinly covered 2028 line and it is $5,456, or 12.7% below. Either way NVR lands between PulteGroup and Toll Brothers rather than at the top. We applied the same change to the other four as a control and none of them moved, because they were already on the analyst path.
Like for like, then, every company in the industry trades between 5% and 20% above what the model says it is worth. The discounted cash flow test agrees with the own-history test: nobody here is cheap.
What the price is already discounting
Everything above is backward looking. The more useful question is what has to happen from here, and consensus estimates give a way to test it: each company's price on 23 September against forecast earnings for the next three fiscal years, set beside its own ten-year median multiple.
Table 9. Price against consensus earnings, versus each company's own median multiple
| Trailing | FY2026 | FY2027 | FY2028 | Own 10yr median P/E | FY2027 vs median | FY2028 vs median | |
|---|---|---|---|---|---|---|---|
| Toll Brothers | 10.7 | 10.6 | 9.7 | 8.6 | 9.72 | 0% | -12% |
| PulteGroup | 11.9 | 11.7 | 10.7 | 9.2 | 8.53 | +25% | +8% |
| D.R. Horton | 13.2 | 13.4 | 12.1 | 10.4 | 11.90 | +1% | -13% |
| NVR | 15.0 | 17.3 | 15.6 | 13.7 | 15.45 | +1% | -11% |
| Lennar | 14.8 | 16.7 | 15.2 | 12.1 | 9.99 | +52% | +21% |
The striking thing is how little separates the top three. Toll Brothers, D.R. Horton and NVR are within two points of each other at every horizon. All three sit roughly on their own decade median on 2027 estimates, and between 11% and 13% below it on 2028. On price alone there is nothing to choose between them. PulteGroup does not reach its own median in either year, and Lennar is still 21% above its norm three years out.
That convergence is worth pausing on, because on trailing earnings the three do not look alike at all: NVR sits on its own history while Toll and D.R. Horton are 11% and 12% above theirs. The gap closes because Toll and D.R. Horton are expected to grow into it, earnings per share rising 10% and 9% from the trailing twelve months to 2027, while NVR's are forecast to fall 4%. They get cheaper by earning more. NVR is already there.
The other half of the forward question is what consensus is actually modelling, and the answer is not a recovery.
Table 10. Consensus earnings three years out, against the decade's best
| FY2028 consensus EPS | Best EPS of the decade | Gap | |
|---|---|---|---|
| Toll Brothers | $15.73 | $15.16 (FY2024) | +3.8% |
| PulteGroup | $12.86 | $14.82 (FY2024) | -13.2% |
| NVR | $454.59 | $540.81 (FY2024) | -15.9% |
| D.R. Horton | $13.54 | $16.65 (FY2022) | -18.7% |
| Lennar | $6.75 | $15.92 (FY2022) | -57.6% |
Three years out, Toll Brothers is the only one of the five expected to exceed its own peak earnings, and only just. Lennar is modelled at 42% of its peak. Whatever these prices contain, a return to 2022 is not it. They are discounting a slow grind back to something short of the last peak, and on that basis the group splits cleanly: three of the five reach their own historical multiple within two years, and two never get there.
What analysts and insiders are doing
Both are supporting evidence rather than the case, so briefly.
Analyst targets followed the price down rather than led it. Lennar's average target fell from 92.28 over the past year to 71.40 over the past month, D.R. Horton's from 168.67 to 159.50, NVR's from 7,799 to 7,125. Against the 23 September close, Toll's median target sits 33% above the price, Pulte's 22%, NVR's 14% and D.R. Horton's 3%, while Lennar's sits 8% below.
Insiders are more interesting, because they diverge from the analysts. Across calendar 2026 the only meaningful insider buying in the group is a single buyer in Lennar: 16 transactions for 2,743,529 shares worth $212.4 million in the third quarter, which is Berkshire Hathaway crossing 10% of the company in the week after Lennar's latest miss. Everywhere else the flow runs the other way, with Pulte insiders selling $26.4 million over the first half, Toll insiders $26.0 million and NVR insiders $9.0 million. The one large buyer in the industry bought the business with the weakest numbers in it, and insiders at the two best-performing stocks sold into the strength. Institutional ownership is above 84% everywhere and does not separate them.
The bottom line
Valuation does not separate these companies. Toll Brothers, D.R. Horton and NVR sit within two points of each other against their own ten-year multiples on both 2027 and 2028 consensus earnings, and within seven points of each other on a like-for-like discounted cash flow. None of the three is cheap and none is expensive. Only PulteGroup and Lennar stand apart, both the wrong way, at 25% and 52% above their own norms on 2027 earnings.
That leaves quality to decide it, and quality is not close. NVR never earned below 17% on invested capital in any year of the decade and reached 37% at the top, against decade averages of 12.3% for Toll and 11.7% for D.R. Horton. It is the only one of the five whose returns are stable rather than improving from a low base or declining outright. It holds net cash where Toll and D.R. Horton carry net debt of 1.1 and 1.2 times EBITDA, and 90 days of inventory against their 479 and 337, because it options land rather than owning it. The best business in the group, at a price no different from the alternatives.
The arguments against are real. NVR's revenue is falling fastest of the five, down 10.6% over twelve months, and its analyst coverage is the thinnest, which is exactly what broke its own valuation model. Toll has the better momentum right now, with revenue down only 1.1% and contracts still growing. D.R. Horton is the only one to have actually turned a quarter. And Lennar below book with Berkshire buying is an argument about asset value that none of our earnings-based tests is built to answer.
Each company still poses its own question. For NVR, whether the land-light model holds if volumes fall further. For Toll, whether the decade of improvement continues and the luxury buyer stays insulated. For D.R. Horton, whether one flat quarter is a floor. For PulteGroup, why the best gross margin in the group has been falling for four straight quarters. And for Lennar, whether an asset worth more than its market price ever earns like one again.
You can work through each company's full profile on its Quality, Peers and Valuation pages, or compare all five side by side in the screener.
Prices are the 23 September 2026 close, and every upside figure is measured against it. Quality, Peers, Valuation and DCF figures come from the 24 September model run, which prices off that close. NVR's like-for-like intrinsic values were produced by re-running our production DCF with the analyst-coverage filter relaxed, read-only, with the other four included as an unchanged control. Financial data from Stockoscope's database, powered by Financial Modeling Prep. Home sales gross margin, order and incentive figures are as reported by each company in its most recent quarterly release. Mortgage and housing supply figures from Freddie Mac and the National Association of Realtors, September 2026.